Flexible Display Market by Application (Smartphone, Tablet, E-reader, Laptop, TV, Smartcard, Wearable Display), Technology (OLED, LCD, E-paper), Component (Emissive &Non-emissive), Material (Polymer, Glass, GRP) & Geography - Forecast & Analysis to 2013 - 2020
By: marketsandmarkets.com
Publishing Date: March 2014
Report Code: SE 2337


Please click here to get the relevant report of Fingerprint Sensors Market by Type (Swipe &Area), Technology, Material (Optical Prism, Piezoelectric, Capacitive & Adhesives), Application (Mobile, Government, Healthcare, Commercial Security & Others) & Geography - Global Forecast to 2014 - 2020
The role of flexible display in display industry has evolved so as to meet the requirements of consumers and more advanced chip designs and packaging technologies. The technological innovations, research, and the fabrication processes of the materials and displays, altogether, have propelledthe display industry to greater heights. As the consumers demand for more functionality in lighter and user-friendly devices, more and more innovative displays are being discovered and designed.
The research published on flexible display covers the significantgame-changing materials, components, technologies like LCD, LED, OLED, TFT, flexible, transparent, or 3D. There are several importanttrends which have been driving the technological innovations in the display industry since its early days which, directly or indirectly, are driving the market, currently. These trends include image quality, screen size, portability, power savings, interconnectivity, and user-friendliness. While these trends still remain as strong undercurrents, new drivers are being introduced which will play more prominent role in shaping the flexible display industry.
The study also talks about the different applications like smart phones, tablets, POP/ESL, laptops, and wearable. The technological segmentation that is described in the study includes LCD displays, LED displays, OLED displays andliquid crystals on silicon displays(LCoS).
Lastly, the research study is segmented on the basis of geography in that is; North America, Europe, Asia-Pacific (APAC), and Rest of the World (ROW).
Apart from the market segmentation, analysisand the respective data, the report also includes qualitative analysis of various market dynamics such as,drivers, restraints, opportunities, burning issues, and winning imperatives. The report includes profiles of prominentmarket players in the flexible display segment and display manufacturers with their respective company market share analysis.
Table Of Contents
1 Introduction (Page No. - 19)
1.1 Key Take-Aways
1.2 Report Description
1.3 Markets Covered
1.4 Stakeholders
1.5 Research Methodology
1.5.1 Market Size
1.5.2 Key Data Points From Secondary Sources
1.5.3 Key Data Points From Primary Sources
1.5.4 Assumptions Made
1.5.5 List of Companies Covered During The Report
2 Executive Summary (Page No. - 28)
3 Market Overview (Page No. - 31)
3.1 Introduction
3.1.1 Display Technology Market Trends
3.1.2 Flexible Electronics Concept
3.1.3 Evolution
3.1.4 Comparison of Display Technologies
3.2 Market Definition
3.3 Flexible Display Life Cycle
3.4 Market Dynamics
3.4.1 Drivers
3.4.1.1 Rapidly Growing Consumer Electronic Goods Industry
3.4.1.2 Distinctive Features
3.4.2 Restraints
3.4.2.1 Competing Technologies
3.4.2.2 Manufacturing Challenges
3.4.3 Opportunities
3.4.3.1 Penetration in Multiple Applications
3.4.3.1.1 Military
3.4.3.1.2 Digital Signage
3.5 Burning Issues
3.5.1 Cannibalization of Display Technologies
3.6 Winning Imperative
3.6.1 Adoption of An Ideal Manufacturing Process
3.7 Porters Five Force Analysis
3.7.1 Degree of Competition
3.7.2 Buyers Power
3.7.3 Suppliers Power
3.7.4 Threat From Substitutes
3.7.5 Threat From New Entrants
3.8 Value Chain Analysis
4 Flexible Display Market By Material (Page No. - 56)
4.1 Introduction
4.2 Polymer
4.2.1 Crystalline
4.2.1.1 Polyethylene Teraphthalate (Pet)
4.2.1.2 Polyethylene Naphthalate (Pen)
4.2.1.3 Poly-Ether-Ether-Ketone (Peek)
4.2.2 Amorphous and Solution-Castable Amorphous
4.2.2.1 Polycarbonate (Pc)
4.2.2.2 Polyethersulphone (Pes)
4.3 Glass
4.4 Glass-Reinforced Plastic (Grp)
5 Flexible Display Market, By Components (Page No. - 64)
5.1 Introduction
5.2 Organic Material (Emissive Layer)
5.3 Substrate
5.3.1 Oled (Plastic/Polymer/Glass Substrate)
5.3.2 LCD (Glass Substrate)
5.4 Conductive Layer
5.5 Backlight Panel (Non-Emissive/LCD)
5.6 Others (Cathode, Anode)
6 Flexible Display Market Forecast, By Applications (Page No. - 72)
6.1 Introduction
6.2 E-Reader
6.3 Smartphone
6.4 Tablet
6.5 Laptop
6.6 E-Paper
6.6.1 Comparison of E-Paper and Existing Technologies
6.6.1.1 E-Paper Display VS LCD
6.6.1.2 E-Paper D
6.6.1.3 Isplay VS Oled
6.6.2 Types of E-Paper Display Technologies
6.6.3 E-Paper Industry Lifecycle
6.6.4 Applications of E-Paper
6.6.4.1 Wearable Display
6.6.4.2 Smart Card
6.6.4.3 Pop/Electronic Shelf Labels (ESL)
6.7 Television
7 Flexible Display Market Forecast, By Technology (Page No. - 122)
7.1 Introduction
7.1.1 Emissive Display
7.1.1.1 Oled
7.1.1.1.1 PM-Oled
7.1.1.1.2 P-Oled
7.1.1.1.3 PHoled
7.1.1.1.4 AM-Oled
7.1.1.1.5 SM-Oled
7.1.1.2 E-Paper
7.1.1.2.1 Electrophoretic
7.1.1.2.2 Electrochromic
7.1.1.2.3 Electrowetting
7.1.1.2.4 Cholesteric Liquid Crystal Diode (CH-LCD)
7.1.2 Non-Emissive Display
7.1.2.1 LCD
7.1.2.2 LCOS
7.2 Display Manufacturing Technology
7.2.1 Flexible Flat Panel Display Technology
7.2.2 Flexible Plasma Display Technology
7.2.3 Photographic Technology
8 Flexible Display Market Forecast, By Geography (Page No. - 144)
8.1 Introduction
8.2 The Americas
8.3 Europe
8.4 Asia-Pacific
8.5 Rest of The World
9 Competitive Landscape (Page No. - 162)
9.1 Market Share Analysis
9.2 New Product Developments/Launches
9.3 Collaboration/Joint Venture/Agreement
9.4 Partnerships/Strategic Alliances
9.5 Mergers and Acquisitions
9.6 Awards/ Recognitions/Other Ventures
10 Company Profiles (Overview, Products and Services, Financials, Strategy & Development)* (Page No. - 175)
10.1 Atmel Corporation
10.2 AU Optronics Corp.
10.3 Corning Incorporated
10.4 Delta Electronics, Inc.
10.5 Dupont Display
10.6 E Ink Holdings, Inc.
10.7 Flexible Display Center (Asu)
10.8 Hewlett-Packard Company
10.9 Kent Displays, Inc.
10.10 LG Display Co. Ltd.
10.11 Materion Corporation
10.12 Nanolumens
10.13 Nokia
10.14 Novaled AG
10.15 Philips Electronics
10.16 Plastic Logic Ltd
10.17 Polymer Vision
10.18 Sony Corporation
10.19 Toppan Printing Co. Ltd.
10.2 Universal Display Corporation
10.21 Visionox
*Details on Overview, Products and Services, Financials, Strategy & Development Might Not Be Captured in Case of Unlisted Companies.
List of Tables (93 Tables)
Table 1 Major Companies Covered During The Report
Table 2 Global Flexible Displays Market Value, By Application, 2013 2020 ($Million)
Table 3 Global Flexible Display Market Volume, By Application, 2013 2020 (Million Square Meter Units)
Table 4 Comparison of Oled VS LCD Technologies
Table 5 Overall Challenges For Oled Compared to LCD
Table 6 Comparison Between Flexible Oled, E-Paper and Flexible LCD
Table 7 Flexible Displays Market Value, By Material, 2013 2020 ($Million)
Table 8 Flexible Display Polymer Material Value, By Type, 2013 2020 ($Million)
Table 9 Flexible Display Crystalline Material Value, By Type, 2013 2020 ($Million)
Table 10 Led VS CCFL Backlight Technologies
Table 11 Global Flexible Displays Market Revenue By Application, 2013 - 2020 ($Million)
Table 12 Global Market Volume By Application, 2013 - 2020 (Million Square Meter Units)
Table 13 E-Reader Volumes By Geography, 2013 - 2020 (Million Square Meter Units)
Table 14 Flexible Display Shipments in E-Reader, By Geography, 2013 - 2020 (Million Square Meter Units)
Table 15 Market Revenue For E-Reader, By Geography, 2013 - 2020 ($Million)
Table 16 Global Flexible Display Shipment For E-Reader, By Technology, 2013 - 2020 (Million Square Meter Units)
Table 17 Global Mobile Display Market, By Technology, 2013 - 2020 ($Million)
Table 18 Smartphone Market Shipments, By Geography, 2013 - 2020 (Million Units)
Table 19 Flexible Display Shipment in Smartphone, By Geography, 2013 - 2020 (Million Square Meter Units)
Table 20 Flexible Display Market Revenue For Smartphone, By Geography, 2013-2020 ($Million)
Table 21 Global Flexible Display Shipments For Smartphone, By Technology, 2013 - 2020 (Million Square Meter Units)
Table 22 Top Tablets Available in The Market
Table 23 Tablet Market Shipments, By Geography, 2013 - 2020 (Million Square Meter Units)
Table 24 Flexible Display Shipment For Tablet, By Geography, 2013 - 2020 (Million Square Meter Units)
Table 25 Flexible Display Revenue For Tablet, By Geography, 2013 - 2020 ($Million)
Table 26 Global Flexible Display Shipment For Tablet, By Technology, 2013-2020 (Million Square Meter Units)
Table 27 Laptop/Notebook Market Shipments, By Geography, 2013 - 2020 (Million Square Meter Units)
Table 28 Global Flexible Display Shipment For Laptop/Notebook Market, 2013 2020 (Million Square Meter Units)
Table 29 Global Flexible Displays Market Revenue For Laptop/Notebook, 2013 2020 ($Million)
Table 30 Global Flexible Display Shipments For Laptop, By Technology, 2013 - 2020 (Million Square Meter Units)
Table 31 Comparison of E-Paper Display and LCD
Table 32 Comparison of E-Paper Display and Oled
Table 33 Comparison Between E-Paper Technologies
Table 34 E-Paper Shipments, By Geography, 2013 - 2020 (Million Square Meter Units)
Table 35 Flexible Display E-Paper Shipments, By Geography, 2013 - 2020 (Million Square Meter Units)
Table 36 Flexible Display Shipments For E-Paper, By Applications, 2013 - 2020 (Million Square Meter Units)
Table 37 Global Flexible Display Revenue For E-Paper, By Applications, 2013 - 2020 ($Million)
Table 38 Flexible Display Shipments For Wearable Display, By Geography, 2013 - 2020 (Million Square Meter Units)
Table 39 Flexible Displays Market Revenue For Wearable Display, By Geography, 2013 - 2020 ($Million)
Table 40 Global Flexible Display Shipments For Wearable Display, By Technology, 2013 - 2020 (Million Square Meter Units)
Table 41 Flexible Display Shipments For Smart Card, By Geography, 2013 - 2020 (Million Square Meter Units)
Table 42 Flexible Display Smart Card Market Revenue, By Geography, 2013 - 2020 ($Million)
Table 43 Global Shipment For Smartcard, By Technology, 2013 - 2020 (Million Square Meter Units)
Table 44 Flexible Display Shipment For Pop/ESL, By Geography, 2013 - 2020 (Million Square Meter Units)
Table 45 Flexible Display Pop/ESL Market Revenue, By Geography, 2013 - 2020 ($Million)
Table 46 Global Flexible Display Shipments For Pop/ESL, By Technology, 2013 - 2020 (Million Square Meter Units)
Table 47 Global Television Market Shipments, 2013 - 2020 (Million Units)
Table 48 Global Flexible Displays Market Shipments in Television, By Geography, 2013 - 2020 (Million Square Meter Units)
Table 49 Market Revenue For Television, By Geography, 2013 - 2020 ($Million)
Table 50 Global Shipments For Television, By Technology, 2013 - 2020 (Million Square Meter Units)
Table 51 Global Market Shipments, By Technology, 2013 - 2020 (Million Square Meter Units)
Table 52 Amoled VS LCD
Table 53 Global Flexible Oled Display Shipments, By Applications, 2013 - 2020 (Million Square Meter Units)
Table 54 Electrophoretic Technology Market, By Geography, 2013 - 2020 ($Million)
Table 55 Electrochromic Technology Market, By Geography, 2013 2020 ($Million)
Table 56 Electrowetting Technology Market, By Geography, 2013 2020 ($Million)
Table 57 CH-LCD Technology Market, By Geography, 2013 2020 ($Million)
Table 58 Global Flexible E-Paper Display Shipments, By Application, 2013 - 2020 (Million Square Meter Units)
Table 59 Global Flexible LCD Display Shipments By Application, 2013 - 2020 (Million Square Meter Units)
Table 60 Flexible Displays Market Revenue By Geography, 2013 - 2020 ($Million)
Table 61 Flexible Displays Market Volume By Geography, 2013 - 2020 (Million Square Meter Units)
Table 62 The Americas: Flexible Displays Market Revenue, By Region, 2013 2020 ($Million)
Table 63 The Americas: Market Shipment, By Region, 2013 2020 (Million Square Meter Units)
Table 64 The Americas: Market Shipments, By Application, 2013 - 2020 (Million Square Meter Units)
Table 65 The Americas: Market Revenue, By Application, 2013 - 2020 ($Million)
Table 66 Europe: Flexible Displays Market Revenue By Country, 2013 2020 ($Million)
Table 67 Europe: Market Shipment By Country, 2013 2020 (Million Square Meter Units)
Table 68 Europe: Market Shipments, 2013 - 2020 (Million Square Meter Units)
Table 69 Europe: Market Revenue, 2013 - 2020 ($Million)
Table 70 APAC: Flexible Displays Market Revenue By Country, 2013 2020 ($Million)
Table 71 APAC: Market Shipments, By Country, 2013 2020 (Million Square Meter Units)
Table 72 APAC: Market Shipments, By Applictaion, 2013 2020 (Million Square Meter Units)
Table 73 APAC: Market Revenue, By Application, 2013 2020 ($Million)
Table 74 ROW: Flexible Displays Market Shipments, By Application, 2013 - 2020 (Million Square Meter Units)
Table 75 ROW: Market Revenue, By Application, 2013 - 2020 ($Million)
Table 76 Top Players in E-Paper Display For E-Reader Market, 2013
Table 77 New Product Developments/Launches, 2009 2014
Table 78 Collaborations/Joint Ventures/Agreements, 2010 - 2014
Table 79 Partnership/Strategic Alliance, 2010-2014
Table 80 Mergers and Aqcuisitions, 2012-2013
Table 81 Awards/ Recognitions/Other Ventures, 2012-2014
Table 82 Atmel: Product offerings
Table 83 Corning: Products and Services
Table 84 Delta Electronics: Product offerings
Table 85 E ink: Products and Services
Table 86 Flexible Display: Product, Applications, and Technology
Table 87 HP: Product offerings
Table 88 LG Display: Products and Services
Table 89 Nanolumens: Products and Solutions
Table 90 Nokia: Products and Services
Table 91 Philips: Products & Services offerings
Table 92 Sony: Product offerings
Table 93 Visionox: Products & Services
List of Figures (52 Figures)
Figure 1 Flexible Display Market Segmentation
Figure 2 Research Methodology To Derive The Market Size
Figure 3 Data Triangulation
Figure 4 Basic Diagram
Figure 5 Display Technology Segmentation
Figure 6 Evolution Graph
Figure 7 Roadmap
Figure 8 Flexible Displays Market
Figure 9 Life Cycle of Flexible Display
Figure 10 Impact Analysis of Drivers
Figure 11 Flexible Display Features
Figure 12 Global Smartphone Shipments, 2007-2017 (Million Units)
Figure 13 Impact Analysis of Restraints
Figure 14 Porters Five Force Model
Figure 15 Value Chain
Figure 16 Flexible Display Glass Material Value, 2012 2020 ($Million)
Figure 17 Emissive Display VS Non-Emissive Display
Figure 18 Oled Structure
Figure 19 Applications of Flexible Display
Figure 20 Technology Comparison, 2013 - 2020
Figure 21 Tablet Market Trend, 2010 2012
Figure 22 Lifecycle of E-Paper Technologies
Figure 23 E-Paper Applications
Figure 24 Technologies With Respect to Applications Matrix
Figure 25 Advantages of ESL
Figure 26 Schematic of An Amoled
Figure 27 LCD Structure
Figure 28 Roadmap to Flexible Flat Panel Display
Figure 29 Flexible Display Using Photographic Technology
Figure 30 Flexible Displays Market Trends, 2013 - 2020
Figure 31 Atmel Corporation: Company Snapshot
Figure 32 AU Optronics: Company Snapshot
Figure 33 AUO: SWOT Analysis
Figure 34 Corning Inc.: Company Snapshot
Figure 35 Corning, Inc.: SWOT Analysis
Figure 36 Delta Electronics: Company Snapshot
Figure 37 Delta Electronics: SWOT Analysis
Figure 38 Dupont: Company Snapshot
Figure 39 Dupont Display: SWOT Analysis
Figure 40 E Ink Holdings: Company Snapshot
Figure 41 E Ink Holdings: SWOT Analysis
Figure 42 Hewlett Packard: Company Snapshot
Figure 43 HP: SWOT Analysis
Figure 44 LG Display Co Ltd: Company Snapshot
Figure 45 Materion Corporation: Company Snapshot
Figure 46 Nokia: Company Snapshot
Figure 47 Novaled AG: Product Portfolio
Figure 48 Philips Electronics: Company Snapshot
Figure 49 Sony Corporation: Company Snapshot
Figure 50 Toppan: Company Snapshot
Figure 51 Toppan: Business Segments
Figure 52 Uiversal Display Corporation: Company Snapshot
The flexible display report, a culmination of extensive primary and secondary research, provides the current size of the global market in terms of revenue; and forecasts the same forthe duration from 2014 to 2020. The report analyzes the global market and presents detailed insights on the market by material, technology, component, application, and geography. Besides, a detailed analysis of the drivers, restraints, and opportunities of the market isalso presented.
The key trends which have emerged in the flexible display market are; the increasing popularity of consumer electronics displays products like TVs, laptops, smartphones, tablets and the likes; technological innovations within the materials, for the introduction of different display products that exhibit the flexibility, fold-ability, and roll-abilityproperties. One of the factors has adversely affected the growth of the materials market are the difficulties facedin the manufacturing and fabrication process of the flexible display technology. The market is growing, globally; this increasing thrust on the flexible display presents vast opportunities for players across the value chain. The market has been segmented as discussed below:
Market by technology The market by technology includes OLED, LCD, LED-LCD, OLED, LCoS, and the likes. The OLED materials market is expected to grow atthe highest CAGR from 2014 to 2020.
Market by material The materials used in the fabrication of flexible displays are glass, glass reinforced plastic, polymer and other materials.
Market by application The application market is segmented into application of materials in smart phones, tablets, laptops, POP/ESL, wearable displays and others.
Market by geography The report discusses the display materials market under four geographical heads; namely North America, Europe, APAC, and ROW.
Flexible Display Market Value, 2013 - 2020 ($ Million)
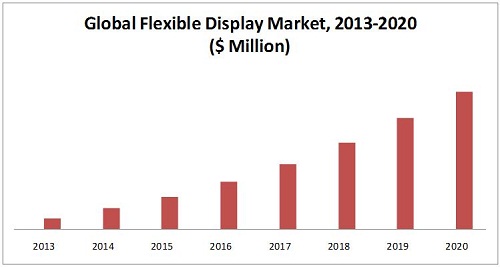
Source: MarketsandMarkets Analysis
We will customize the research for you, in case the report listed above does not
meet with your exact requirements. Our custom research will comprehensively cover
the business information you require to help you arrive at strategic and profitable
business decisions.
Please visit http://www.marketsandmarkets.com/knowledge-process-outsourcing-services.asp to specify your custom Research Requirement

